Percentage of households buying rice, at any time of the year 2007, in communes of Madagascar.
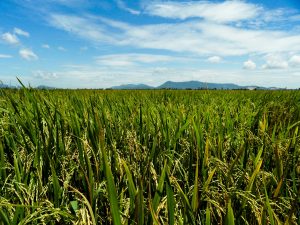
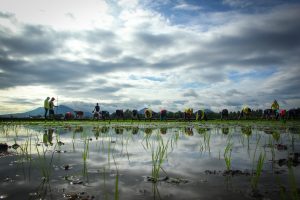
Rice is the staple food of Madagascar, and 60% of the workforce is involved in rice farming. The crop is grown all over the country, except in the arid southwest of the island (Map 1). The principal rice production areas are in the central highlands. About 1.25 million hectares are planted to rice each year, with an average yield of 2.8 tons per hectare. Rice is produced mainly in flooded conditions and is mostly rainfed with limited opportunities for irrigation. Slash-and-burn agriculture characterizes Madagascar’s steep eastern slopes, threatening remaining refuges of the country’s unique flora and fauna. There is also nonflooded rainfed rice in more permanent agricultural fields on the high plateau.
Around 60% of Madagascar’s population earns less than a dollar per day. The price of rice, therefore, has a major impact on the welfare of both rice producers and consumers. Here we illustrate how rice prices vary between regions and seasons, using data from commune censuses of 2001 and 2007 in which the rice price was recorded for each quarter (Madagascar is subdivided into more than 1,500 communes). Rice prices in Madagascar are lowest after the main April-June harvests and then increase by about 40% in December. The high prices during the “hunger season” reflect the increasing demand and the cost of storage, capital, transportation, handling, and losses. During this period, the rice price is effectively capped by the price of imported rice.
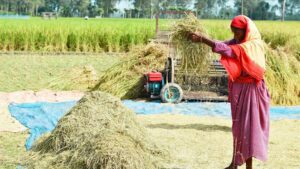
Many households sell rice after the harvests because they need cash, only to buy rice again later in the year. In April-June, only 18% of these communes have more households that buy rice than sell rice. In October-April, however, 77% of communes have a majority of rice-buying households. Map 2 shows the peak percentage of households that buy rice at any time during the year (in most communes, the peak buying time occurs in the first quarter of the year).
Large differences in prices and in price fluctuations exist between regions.Map 3 shows a spatial price index, based on an average over four trimesters for 2001 and for 2007. The national average has an index of 100. Areas with low rice prices are in blue and areas with high prices are in red. Eleven percent of the communes have a price that is, on average, 20% higher than the national average, and 10% of the communes have a price that is 20% lower than the national average. The highest prices tend to occur in the more isolated areas where there is little rice production.
Map 4 shows the temporal variation in prices, computed as the average within-year variation of the rice price, expressed as the average deviation from the mean annual price. Areas with a stable price throughout the year are colored blue, and areas with large fluctuations are colored red. Half the communes have an average yearly price variation of 20% or more.
In the harvest season, the price of rice tends to be higher near cities because of lower transportation costs from farm to market. In other words, in the harvest season, rice in more remote areas is sold at lower prices to make up for higher transportation costs to the market. In contrast, because storage tends to be in larger towns, off-season prices tend to be highest in remote areas because of additional transportation costs. This partly explains why spatial and temporal variabilities in rice prices are not at all correlated (correlation coefficient = 0.1). Many additional factors play a role in determining rice prices. Flooded roads in the wet season, which isolate some areas, are particularly disruptive, while the northern part of the country is vulnerable to cyclones. Each year, such events cause the formation of “enclaves”—temporally isolated areas that can experience sharp hikes in the rice price.
Rice production in Madagascar has not kept up with population growth, despite a decrease in per-capita rice consumption. About 10% of the country’s rice is imported and the government has called for a Green Revolution to change this situation. Knowledge of the factors that shape spatial and temporal variation in the rice prices could help guide investments to help people who are most vulnerable to high prices.

